

Government Investment in Jobs, Its Connection to Green Energy and Rewarding Voters
Government Investment in Jobs, Its Connection to Green Energy and Rewarding Voters
One Foot in the Gravy

Jobs are in the headlines today, with very high-priced legislation leading the way. If we want to create jobs, I assume we should understand what it costs to create that job and how many other jobs can be created from it. This occasioned a revisit to an Economic Policy Institute report I had first read in 2003 when researching the economic impact of creating a new job. An investor seeking to improve employment in a poor area wanted to know what the impact would be of investing $1M in a new venture. Several opportunities were available.
The report, which carries the sexy and tantalizing title “Updated Employment Multipliers for the U.S. Economy,” is fascinating to nerds, quants, consultants and people interested in results instead of headlines. Every government program promises it will create some calculated number of new jobs by opening a new shopping mall, or childcare center, or manufacturing plant, and promises a vague number of other jobs created through the ripple effect. Most people focus first on the number of new jobs directly created, and assume that a job is a job is a job. As Sportin’ Life famously noted in George and Ira Gershwin’s musical Porgy and Bess, It Ain’t Necessarily So.
<iframe width="555" height="313" src="
title="YouTube video player" frameborder="0" allow="accelerometer; autoplay; clipboard-write; encrypted-media; gyroscope; picture-in-picture" allowfullscreen></iframe>
The report measures two areas influenced by the creation of the new jobs. The author uses the term linkages to describe the areas: backward linkages are the sources of materials and services the new venture uses, usually called the backwards supply chain; and forward linkages, the employment effect of spending by the new direct employees for food, entertainment, shoes, etc. The unsurprising conclusion is that not all new jobs are equal. Some jobs are significantly more equal than others, primarily determined by the efficiency of labor capital.
The information can help investors decide where to put their money, of course. It can also help elected officials determine what policies will be most beneficial to the economy and employment. If widely-shared, it can help voters detect when their elected officials are being truthful. It can be used by high school students to help make decisions about colleges and vocational schools, by highlighting what areas are most likely to attract investment.
There is an ongoing discussion about socially-responsible investment, urging investors to put their money where it can do the most social good. In my lifetime there have been two international campaigns with clearly-defined social responsibility issues. The first was investment in South Africa, which maintained a system of apartheid that was indefensible. The less well-remembered one was also in Africa, and was about investment in Nigeria which had implemented a blockade of the breakaway state of Biafra. In the end Biafra surrendered after two million people, mostly children, died of starvation from the blockade. Other than these, I have not heard of a politically successful investment blockade in the past thousand years.
The data clearly show that simply creating a direct job has vastly different impacts depending on the industry. For example, investing in childcare and creating 100 direct jobs will create only 62.7 additional jobs, while creating 100 direct jobs in manufacturing durable goods made from steel will create 1,289.1 additional jobs. But most investors are interested in how many jobs will be created from a set amount of money. It is in that question that the cost to create a job becomes clearer. To create one food service job costs about $87,000. That probably sounds like a lot, and if it costs that much, why do food service jobs only pay minimum wage?

The cost to create a food service job isn’t just the salary paid to the worker. There usually needs to be a building, and land on which to locate the building. Construction and equipment costs for a McDonald’s vary between $1 million and $2.2 million. The franchise itself costs $45,000, one of the least expensive items. When McDonald’s offers a new item, it often requires an investment in a new piece of equipment. An espresso machine costs $13,000, a Create Your Taste kiosk goes for $125,000, and even muffin equipment can cost $4.500. In addition to salaries and food, the franchisee owns the building but not the land; that is rented from McDonald’s at between 4% and 8.5% of revenue. Local stores also pay for advertising and must buy all McDonald’s label items from the company. High turnover increases costs of recruitment and training, so the money going into creating a food service worker’s job is considerable.

The backwards supply chain and the spend by food service workers then creates an additional 1.15 jobs. This is quite different from durable goods manufacturing, such as automobiles or washing machines, where the direct cost to create one job is about $555,500. That is because punches, lathes, metal-forming equipment and paint booths cost a lot more than stoves and ovens. In addition, manufacturing jobs pay well because they take a long time to learn how to do, and the level of responsibility is significantly greater. Each manufacturing job creates about 9.17 additional jobs. This is why unions and workers are so vocal about manufacturing jobs. When one disappears, it’s actually ten jobs disappearing. When one food service job disappears, it’s actually two jobs. Quite a difference.
When traditional infrastructure bills are passed, they create many jobs. Construction work needs about $181,800 to create a job. Most of that is the cost of equipment, maintenance and construction materials. Utilities work is the most expensive, costing $1M to create each job. Each utilities job created results in creation of more than ten other jobs; a construction job creates about two other jobs.
Mining is largely automated nowadays in North America. That’s one of the reasons it costs about $770,000 to create one mining job. Each job then creates an additional 4.5 jobs in manufacturing and employee spending. Banning energy sector mining, which the Green New Deal does, will do away with good paying jobs, and the idea that miners can simply learn how to code won’t have the same impact on the economy as the mining jobs that disappear. It costs $500,000 to create one information job, which then creates an additional 5.45 jobs. So, it’s even better than mining, right? Not quite. The bulk of the additional jobs result from spending the coder’s salary, not producing items. The new jobs are mostly low-paying service jobs.
When we don’t know what we’re talking about, and try to redefine terms in order to command and shape the deceptive narrative, we wind up defining infrastructure as anything that supports getting a human being to work. Food and drink are infrastructure. Child care is infrastructure. Housing is infrastructure. Elder care is infrastructure. Further subsidizing electric vehicles is infrastructure. Not merely closing but sealing mining facilities to produce gas, oil and coal is infrastructure.
To build back better first we have to destroy what we have, such as energy independence, and trust that experts committed to the Green New Deal have all the needed information to do away with 1.2M jobs in energy extraction and eleven thousand pipeline jobs knowing that they will get better jobs in renewable energy. Renewable energy jobs include manufacturing solar panels, in which China dominates the global market. The Chinese government has withdrawn all government subsidies to its solar panel manufacturers, so its prices are transparent. A Chinese-produced solar panel, even after paying a 30% US tariff, is less expensive per watt installed than a US solar panel. In the U.S. we obscure the cost of solar energy with government subsidies. Even with subsidies a residential solar power system costs $2.33 per watt; in China, the cost is around $1 per watt. The same applies in the Netherlands, where there are no subsidies for solar installations. The Dutch pay $1.00 per watt.
We often look to Europe to inform us. In Green jobs, there is little help. Spain has had the worst experience, with new Green jobs requiring government subsidies of between $752,000 and $1.4M to create, and eliminating 2.2 jobs elsewhere in the economy for each new Green job. The Netherlands ranks dead last in the European Union, producing only 8.6% of its power from renewable resources. Ironically, the land famous for windmills generates little commercial wind energy. It has some commercially viable onshore wind and a bit more offshore. The country’s economy is export-driven, mostly by sea, and setting up obstacle courses for marine traffic isn’t a popular option. The reason for the Netherlands paucity of renewable energy is that the two most effective forms are hydropower and nuclear power. There is no real hydropower in the country (it’s flat, reducing the number of waterfalls), and nuclear power is problematic in Europe for reasons that would derail this article.
The EU is less than half the size of the US, and distances are shorter. Fossil fuel plants can be located almost anywhere, so they usually locate near where demand exists. Renewable energy is less mobile. The wind fields of Texas are between 320 and 740 km from manufacturing centers, at the upper end about the same as the distance between Luxembourg and Prague. Transmission costs are typically measured in dollars per Megawatt-kilometer. In the US that can go as high as $10,000. In the EU, it is between $867 and $7,903 depending on distance. The lower figure is for one km, the latter for 15 km. The longer the distance, the higher the transmission cost. This is due to a variety of factors from line loss to the inevitability of needing to cross very expensive land.
There is little to learn from Europe about the transmission issue due to order-of-magnitude differences in distance. There is a great deal to learn from our own sunlight data, which we have in abundance. That is, both sunlight and data in abundance.
The sunniest states are best for producing electricity from solar, and are New Mexico, Arizona, California, Nevada, Texas, Utah and Colorado. The least sunny states that are worst for producing solar electricity are in the Northeast, upper Midwest and coastal Northwest.
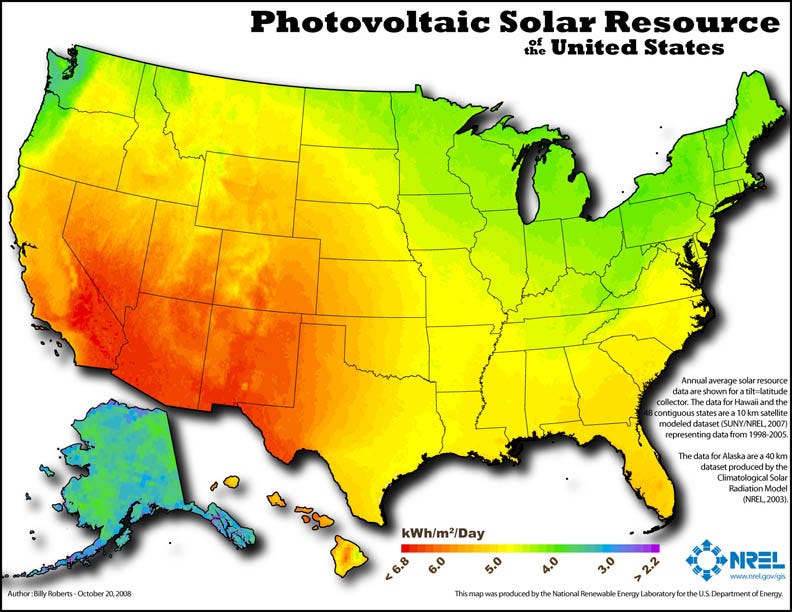
The map above shows the nature of the problem. The areas least capable of generating solar electricity are the most densely populated and contain the bulk of US manufacturing. Thus, they use the most power. The areas that are most capable of generating solar electricity are about three thousand kilometers away. Phoenix and Las Vegas are the only big consumers of power between Fort Worth Texas and Los Angeles. The generators of power will doubtless be expected to pay for its transmission, at a price of several trillion dollars. If “equity” demand that everyone pay the same rate for electricity, the areas that produce electricity will subsidize areas that consume it. Most readers will be able to overlay political voting patterns on this map. There is a disparate impact, intentional or not, on different voting groups.
So, our energy sector workers can indeed get new jobs; they just have to move to Shanghai or Beijing to perform them. The forward and backward linkages should create additional jobs in China. Meanwhile, the Washington Post reports we are budgeting $400B for expanded elder care, which the Bureau of Labor Statistics states pays a median $13.02 for workers in that field. Each such institutional (nursing home, assisted living, etc) job requires $128,000 to create, but produces only 1.78 additional jobs. Daily Pay reports that annual turnover rate is about 70%. The provisions of the bill encourage home healthcare workers to join SEIU, a large union that gives 99% of its donations to Democrats.
I see nothing wrong with supporting elder care, so long as we call it that and not infrastructure, and we recognize that as we do that China is continuing to take Green Energy jobs from us. I see nothing wrong with destroying our energy independence, in confidence that we will build back better. I’d require that each member of Congress who votes to do so place his or her own wealth in a trust to support millions of Americans in case our confidence was misplaced. That wealth would also be required to support the 1.2M+ current job-holders in fossil fuels and the forward and backward linkages jobs (about 10M) that they create, plus families and other dependents, until the better jobs appear.
In summary, unless we know how jobs are created, by whom, at what cost, and recognize that not all jobs are created equal, making national policy in the dark is dangerous to our national health. We need to call things what they are, not what we would like them to be. We need to look at the ripple effect of establishing a new job, choosing industries that benefit the country as a whole.
Having already quoted from Porgy and Bess, I’ll close with a quote from Gilbert and Sullivan’s H.M.S. Pinafore, as sung by the great philosopher Buttercup:
Things are seldom what they seem,
Skim milk masquerades as cream;
Highlows pass as patent leathers;
Jackdaws strut in peacock's feathers.

Cab Calloway and Buttercup. TY!